오늘 목표
오늘은 파이썬 범례를 다양하게 추가할 수 있는 방법을 알아보겠습니다. 특히, 범례를 가로로 나열하고, 범례 순서를 바꾸는 방법을 알아볼게요.
라이브러리 불러오기
import pandas as pd
import matplotlib.pyplot as plt
import matplotlib.patches as mpatches #범례 그리기 위한 라이브러리
import matplotlib.lines as mlines #범례 그리기 위한 라이브러리
데이터 불러오기
엑셀에 있는 데이터를 불러와서 작업을 주로 하지만, 오늘은 랜덤 한 시계열 데이터(time series)를 생성하여 그래프를 그려볼게요. 엑셀 데이터 불러와서 그래프 그리는 법은 여기에서 확인해 주세요.
2개의 그룹이 3가지의 컨디션에 해당하는 데이터로, 총 6개의 시계열 데이터입니다. 2개의 그룹과 3가지 컨디션을 표현하는 그래프를 그려보려고 해요.
# data
np.random.seed(123)
young_cond_1 = pd.Series(np.random.randn(100)).cumsum() #그룹1_컨디션1
young_cond_2 = pd.Series(np.random.randn(100)).cumsum() #그룹1_컨디션2
young_cond_3 = pd.Series(np.random.randn(100)).cumsum() #그룹1_컨디션3

old_cond_1 = pd.Series(np.random.randn(100)).cumsum() #그룹2_컨디션1
old_cond_2 = pd.Series(np.random.randn(100)).cumsum() #그룹2_컨디션2
old_cond_3 = pd.Series(np.random.randn(100)).cumsum() #그룹3_컨디션3
그래프 그리기 - 범례
6개의 시계열 데이터를 그래프에 표현해 볼게요. Young에 해당하는 그룹은 검정색, Old 그룹은 빨간색으로 범례를 표현할 것이고, 3가지 컨디션은 선, 점선 2종류로 표현할 거예요. 아래 코드가 위의 데이터를 시각화할 전체 코드이고요. 이 코드를 조금씩 변형해서 범례를 수정해보려고 합니다.
# plot
fig,ax = plt.subplots(figsize=(10,5))
x = np.linspace(1,100,100)

ax.margins(x=0)
ax.set_title ('title', fontsize = 23, pad = 30) #그래프 제목
ax.set_ylabel ('y axis (unit)', fontsize = 18) #x축 제목
ax.set_xlabel ('x axis (unit)', fontsize = 18) #y축 제목
condition1, = ax.plot(young_cond_1, c ='k', label ='Young condition1') #그룹1_컨디션1
condition2, = ax.plot(young_cond_2, c ='k', ls =':', label ='Young condition2') #그룹1_컨디션2
condition3, = ax.plot(young_cond_3, c ='k', ls ='--', label ='Young condition3') #그룹1_컨디션3
O_condition1, = ax.plot(old_cond_1, c ='red',label ='Old condition1') #그룹2_컨디션1
O_condition2, = ax.plot(old_cond_2, c ='red',ls =':', label ='Old condition2') #그룹2_컨디션2
O_condition3, = ax.plot(old_cond_3, c ='red',ls ='--', label ='Old condition3') #그룹2_컨디션3

ax.legend(handles=[condition1, condition2, condition3, O_condition1, O_condition2, O_condition3], loc = 'best')
plt.show()
그래프 그리기 - 범례 추가
범례를 조금 더 깔끔하게 정리를 해보려고 해요. 컨디션에 해당하는 부분은 ax.plot 부분에 label을 이용해서 표현했고, 그룹에 해당하는 부분은 mpathches를 사용해서 추가적으로 범례로 표현했습니다.
# plot
fig,ax = plt.subplots(figsize=(10,5))
x = np.linspace(1,100,100)

ax.margins(x=0)
ax.set_title ('title', fontsize = 23, pad = 30) #그래프 제목
ax.set_ylabel ('y axis (unit)', fontsize = 18) #x축 제목
ax.set_xlabel ('x axis (unit)', fontsize = 18) #y축 제목
condition1, = ax.plot(young_cond_1, c ='k', label ='condition1') #컨디션1
condition2, = ax.plot(young_cond_2, c ='k', ls =':', label ='condition2') #컨디션2
condition3, = ax.plot(young_cond_3, c ='k', ls ='--', label ='condition3') #컨디션3
ax.plot(old_cond_1, c ='red')
ax.plot(old_cond_2, c ='red',ls =':')
ax.plot(old_cond_3, c ='red',ls ='--')


Young = mpatches.Patch(color='k',label = 'Young n=10') #그룹1
Old = mpatches.Patch(color='red',label = 'Old n=10')  #그룹2


ax.legend(handles=[Young, Old, condition1, condition2, condition3], loc = 'upper left')
plt.show()

범례 수정 - 순서 바꾸기
ax.legend의 handles 부분에 원하는 항목의 순서대로 입력해주면 됩니다. 위에서는 Young, Old, condition1, condition2, condition3이었다면, 이번에는 condition1, condition2, condition3, Young, Old 순으로 바꿔볼게요.
ax.legend(handles=[condition1, condition2, condition3, Young, Old], loc = 'upper left')
plt.show()
범례 수정 - 위치 바꾸기
loc에 해당하는 부분에 원하는 위치에 해당하는 것을 입력해주면 됩니다.
best
upper right
upper left
lower left
lower right
right
center left
center right
lower center
upper center
center
범례 수정 - 가로 범례
범례를 가로로 표현해볼게요. 위의 코드에서 ax.legend 부분에 ncol 항목을 추가해주면 되는데요. 6개의 항목을 모두 하나의 가로 형태로 표현해 보겠습니다. 항목이 6개니까 ncol=6으로 입력해 줬어요.
ax.legend(handles=[Young, Old, condition1, condition2, condition3], loc = 'upper left',  ncol=6)
plt.show()

ncol=3으로 하면 3 * 2의 형태의 범례가 만들어집니다.
ax.legend(handles=[Young, Old, condition1, condition2, condition3], loc = 'best',  ncol=3)
plt.show()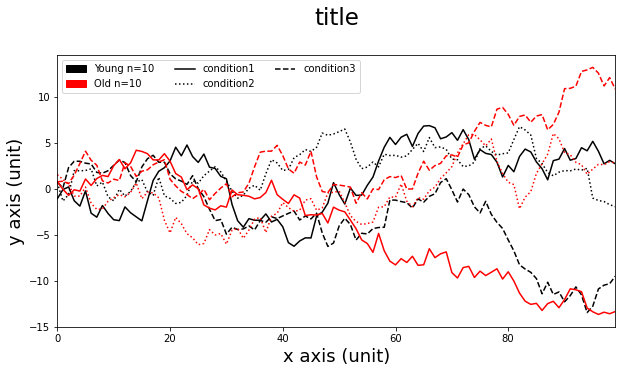
파이썬 범례 내 맘대로 수정하기
범례를 그래프 밖으로 옮기고 싶은 경우, 범례 배경, 라인 변경하는 방법 등은 저의 다른 포스팅에서 확인해 보세요.
파이썬 그래프 범례 내 맘대로 수정하는 법 (matplotlib)
오늘 목표 오늘은 파이썬 그래프 범례를 여러가지 스타일로 바꾸어 보는 방법을 알아 보겠습니다. 라이브러리 가져오기 import matplotlib from matplotlib import font_manager,rc #한글 폰트 입력을 위한 라이
dotorimj2.tistory.com
'코딩' 카테고리의 다른 글
| 상자수염 논문 그래프 (Box and whisker plot, 파이썬, Q1, Q2, Q3 계산) (0) | 2023.05.04 |
|---|---|
| 파이썬 엑셀파일에서 필요한 열 전체 추출 후 엑셀파일에 저장 (쥬피터 노트북) (0) | 2023.01.13 |
| 엑셀 파일 csv로 변환 코드 (tsv, sto, xlsx ↔ csv) (0) | 2021.06.17 |
| 데이터 마이닝 :: 케이무크 무료 대학 강의 (0) | 2021.06.12 |
| 엑셀 파일 CSV 변환, 파이썬으로 파일 불러오기, 데이터 추출 3가지 방법, 그래프 그리기 (pd.read_csv VS np.loadtxt) (1) | 2021.05.22 |
댓글